How sankey graph supercharges your e-commerce business
Haokai • 2024-08-05
Unlock e-commerce insights with Sankey graphs. Visualize customer journeys, optimize inventory, and enhance marketing strategies with this powerful tool.

Understanding sankey graph
Running an online shop is a tiring business. between setting up online campaigns, ordering inventories for the holiday seasons, and answering customer requests, company owners are often bombarded with data from all around the business. That's where sankey graphs come in. This amazing visualisation brings structure and transparency to the e-commerce business in an engaging and easy-to-understand way. In this guide, we'll explore Sankey graphs, how they work, and why they can be a game-changer for understanding your e-commerce data.
What is a sankey graph?
Imagine a map where the width of the roads represents the volume of traffic. That's essentially what a sankey graph does for data. Named after Matthew Henry Phineas Riall Sankey, who used this type of diagram to visualize steam engine efficiency, sankey graph shows the flow of information in a way that's easy to grasp. The thicker the line, the greater the volume it represents. This makes it simple to see where resources are coming from and where they're going.
How does a sankey graph work?
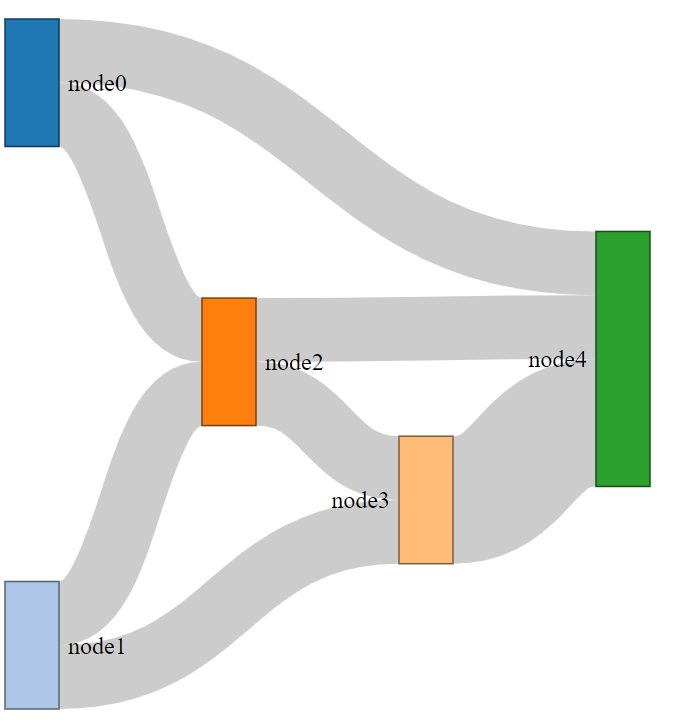
Sankey graph effectively maps out the different categories of your process, and the flow of data through each 'categories'. Each line, or "flow," connects different "nodes," representing data points or categories. For example, in an e-commerce setting, nodes might include product categories, traffic sources, or stages of the purchase funnel. Once you understand its components, it becomes a powerful tool for data visualization
The beauty of a sankey graph lies in its ability to represent both the direction and magnitude of flows. The lines are drawn proportionally to the quantity they represent, making it easy to compare different data streams. This visual hierarchy allows you to quickly spot trends, patterns, and outliers.
Benefits of using sankey graph
One of the main advantages of sankey graph is its ability to simplify complex data sets. Traditional charts and tables can be overwhelming, especially when dealing with large amounts of information. Sankey graph, on the other hand, provides a clear and intuitive way to understand data flows.
Another benefit is its versatility. sankey graph can be used in various fields, from energy management to financial analysis. In e-commerce, it can help you track customer journeys, monitor inventory flows, and analyze sales data. This flexibility makes them a valuable tool for any data-driven decision-making process.
Sankey graph is also great for storytelling. By visualizing data dynamically and engagingly, you can convey complex information more effectively. This is particularly useful when presenting data to stakeholders who may not have a technical background or specialised know-how in that field. A well-designed sankey graph can turn dry statistics into a compelling narrative.
How sankey graph enhances e-commerce analytics
Visualizing Customer Journeys
One of the most significant benefits of sankey graph in e-commerce is its ability to map out customer journeys. Every E-commerce business leader would know the importance of understanding their customers’ journey before eventually making a purchase. Sankey graphs make this process simple and visually appealing. With Sankey, you can see the entire journey from the first touchpoint to the final purchase, all in one place.
Picture this: a potential customer finds your site through a Google ad. They browse a few products, add one to their cart, but leave without purchasing. Later, they return via a promotional email, finally making the purchase. A sankey graph will clearly show each step, helping you identify where you might lose customers and where you can improve. By visualizing these steps, you can better tailor your marketing strategies to keep customers engaged and guide them smoothly to the checkout.
Optimizing product flows and inventory management
In addition to tracking customer journeys and sales, sankey graph is excellent for optimizing product flows. It's like having a bird's eye view of your entire inventory process, showing you how efficiently products are moving and where there might be bottlenecks.
For example, a sankey graph can highlight if certain products are sitting in inventory for too long while others are flying off the shelves. This information allows you to make data-driven decisions about restocking, promotions, and even product discontinuations. You can streamline your inventory management, reduce waste, and ensure that your customers always find what they're looking for.
Enhancing Marketing Strategies
Another fantastic use of sankey graph in e-commerce is in enhancing your marketing strategies. By visualizing how different marketing channels contribute to sales, you can optimize your marketing spend. You can see which campaigns are driving traffic and which are converting that traffic into sales.
Imagine you run multiple marketing campaigns across social media, email, and paid ads. A sankey graph can show you which channels are most effective at each stage of the customer conversion. With this knowledge, you can allocate your budget more efficiently, focusing on strategies that yield the best results.
Detecting Fraudulent Activities
Sankey graph can also help in detecting fraudulent activities. By visualizing transaction flows, you can spot unusual patterns that might indicate fraud. For example, if you notice an unusually high volume of refunds from a specific source, you can investigate further. Sankey graphs make these patterns easy to spot, allowing you to take action quickly.
Integrating AI analytics with sankey Graph
The Power of AI in Analytics
Let’s add AI analytics to the power of a sankey graph. At Zinc, we noticed that AI analytics can process vast amounts of data quickly and accurately while reducing the probability of human error and innate bias. Combining AI with sankey graph makes visualizing insights much more timely and convenient.
Seamless Integration for Better Insights
Most analytics platforms now offer built-in support for sankey graph, such as Plotly, Tableau, and PowerBI. At Zinc, we have further integrated Sankey into our AI chatbot, making it possible for our clients to have an overview of their business just by asking. Click here to learn more.
Enhanced Decision-Making
An AI-integrated analytics tool doesn’t just help in understanding data; it enhances decision-making. With clear visuals presented in a sankey graph, you can make informed decisions faster. For example, if you notice a significant drop in a particular product category, you can quickly decide to run a targeted marketing campaign to boost sales. AI will have already highlighted this issue, and the sankey graph will show you the flow and impact of this drop, making your decision process seamless and straightforward.
Predictive Analytics and Future Trends
One of the most exciting potentials of integrating AI analytics with sankey graph is predictive analytics. AI can forecast future trends based on historical data. When combined, these predictions become visually clear. For instance, if AI predicts a surge in demand for a product next month, sankey graph can show you the projected flow of this demand. This allows you to prepare in advance, ensuring you have enough stock and resources to meet the demand.
User-Friendly and Engaging
Despite the powerful insights they provide, AI analytics and sankey graph are user-friendly. You don’t need to be a data scientist to use them. Zinc offers intuitive interfaces that prepare the right sankey graph with the callout you need. This means you can focus on making strategic decisions rather than getting bogged down by complex data analysis. On top of that, Sankey graphs are visually appealing, making your reports more engaging.
Conclusion
In conclusion, sankey graph is a game-changer for e-commerce businesses. By visualizing customer journeys, optimizing inventory, and enhancing marketing strategies, they turn complex data into a compelling narrative. Integrating AI analytics only further amplifies their potential, making decision-making seamless and future trends predictable. So why not give it a try? Embrace the power of AI and sankey graph, and discover the transformative impact AI can have on your business.
See More Posts


Zinc Technologies
Copyright © 2024 Zinc Technologies. All rights reserved.